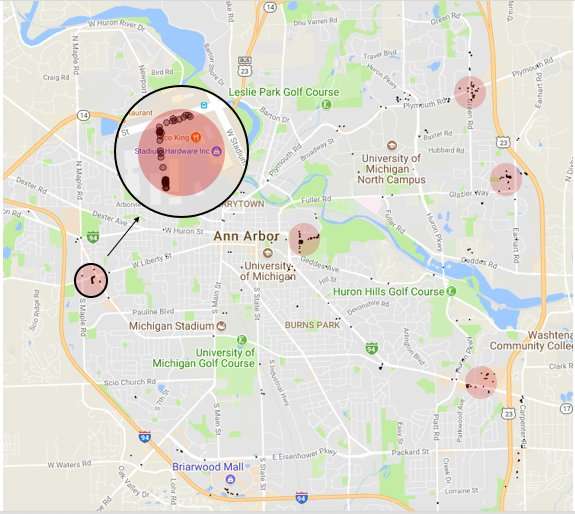
Ann Arbor map: activity clusters for one driver during the period of Jan 1, 2013-Dec 31, 2015 Credit: Zhenyu Shou, Zhaobin Mo/Columbia Engineering
November 19, 2018—Estimating travel demand in a city is a critical tool for urban planners to understand traffic patterns, predict traffic congestion, and plan ahead for transportation infrastructure maintenance and replacement. For years, researchers have used the classic practice of multiplying the number of trips per day per person for different demographic groups to model activity-based travel demand. But because this method was developed before the current era of ubiquitous sensors—GPS devices, smartphones, cameras on light poles, and connected vehicles, among them—researchers have found it difficult to validate their estimates in real-world situations.
Mining data to analyze tracking patterns, Sharon Di, assistant professor of civil engineering and engineering mechanics at Columbia Engineering, has discovered that she can infer the population travel demand level in a region from the trajectories of just a portion of travelers. She took data collected from the world's first and largest connected vehicle testbed in Ann Arbor, led by University of Michigan Transportation Institute (UMTRI), and analyzed 349 vehicles' continuous one-year mobile traces (19,130 travel activities). She found three distinct groups and inferred their demographics based on their travel patterns:
- Seniors, who travel to a wider variety of places in a day
- Workers, who stay mostly at work or at home
- Parents, who visit more individual places in a day
She and her Ph.D. student Zhenyu Shou then validated their inferred demographics using survey data from UMTRI. Their findings are outlined in a study published by Transportation Research Part C September 18.
"With the popularity of sensors everywhere, from our pockets to our cars, we can now trace individuals in terms of where they go, at what time, and what activity they may perform—essentially, where you go tells who you are, and vice versa," says Di, who is also a member of the Data Science Institute. "What we've learned from our analysis of the Michigan data will help us utilize future data collected from New York City's connected vehicles testbed to understand mobility patterns in the city and help relieve traffic congestion."
One traveler's continuous GPS traces April 29-Nov 4, 2013. Credit: Zhenyu Shou, Zhaobin Mo/Columbia Engineering
Because people tend to visit the same places for daily activities such as work, shopping, and dining, everyday mobile traces tend to be repetitive, but random events create deviations. Because most existing studies use just a single day or a few days of a smaller subset of people's mobile traces, they do not accurately or fully capture their longer term travel routines. A day or two of mobile traces also fails to capture recurring traffic jams.
Di believes her study is the first to use data from an entire year. She built a probability tree for each driver to describe the frequency of their traces in a year and then used data mining tools to see to what extent the similarity of socio-demographics could explain travel patterns. She discovered that those who have similar mobility patterns are likely to belong to the same demographic group.
Her work can be extended either to infer an unknown user's demographic, or customer profiling, based on activity patterns, or to reconstruct an unknown user's frequent activity patterns based on demographics and similar travelers' patterns. By establishing a quantitative relation between human mobility patterns and demographics, Di has laid a theoretical foundation to use individual mobile traces, which contain a sequence of places people visit, to estimate travel demand.
"Di's and Shou's work demonstrates the utility of data science tools for discovering human mobility patterns," says Gowtham Atluri, a computer science professor at the University of Cincinnati, an expert in spatial-temporal data mining who was not involved in the study. "Their overall framework is innovative and highlights the need for collaborative endeavors between transportation and data science researchers."
Di is looking now at scaling up a small sample of mobility patterns to a larger city level. New York City has one of the three US Department of Transportation connected vehicle testbeds and Di plans to collect a large amount of vehicle mobile traces. Once she has this data, she will generate human mobility patterns using the City's demographics, easily obtained from national census data.
"There are so many more connected vehicles on the roads now that can "talk" both to each other and to roadside infrastructure to communicate where their exact location is and at what time," Di observes. "Our synthetic trajectories will help city planners to predict traffic congestion and actively manage traffic."
More information: Zhenyu Shou et al, Similarity analysis of frequent sequential activity pattern mining, Transportation Research Part C: Emerging Technologies (2018). DOI: 10.1016/j.trc.2018.09.018
Journal information: Transportation Research Part C: Emerging Technologies


