Analyzing and developing algorithms for time-varying data

Jules Wulms, Ph.D. student in the research group Applied Geometric Algorithms of the department of Mathematics and Computer Science, has developed a new theoretical framework for the analysis of algorithms for time-varying data.
Time-varying data play a large role in our everyday lives. The stock-market, weather forecasts and traffic information are all based on data that is constantly changing. To use this data effectively, we need to closely analyze the data to gain insights into the underlying patterns and processes. These insights can then be used to make educated predictions and decisions. Algorithms are used throughout this whole process, to do the analysis of available time-varying data as well as compute predictions and visualizations to aid in data-driven decision making.
To make effective use of algorithm to analyze and visualize time-varying data, it is important that certain properties of the data are preserved. One of these properties is the amount of change over time. Time-varying data often changes continuously and smoothly, without many big and sudden changes. To reflect this continuity, an algorithm should ensure that small changes in the input data should lead to small changes in the output. We say that algorithms which have this property are stable, and the stability of an algorithm can act as a measure for how well an algorithm can preserve the continuous changes in the data.
Framework
Analyzing the stability of an algorithm is not an easy task, since stability can defined in a multitude of ways. In our research, we developed a framework of definitions that allows for stability to be measured in various ways: For some algorithms the output may not change continuously, but we can measure the number of discontinuities and try to reduce how often these discontinuity takes place to improve stability. On the other hand, when the output is continuous, stability is measured differently, but we should be cautious of the speed at which changes take place. If we bound how much change is allowed in a short time span, we arrive at a definition that comes very close to the intuitive definition above. However, it also becomes harder (or sometimes provably impossible) to achieve stability. The other definitions of stability relax the constraints, so that we can still obtain insights in the stability of an algorithm in these cases.
Fishes
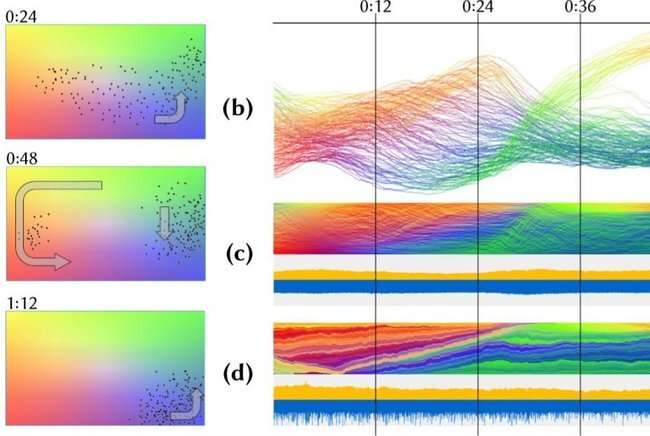
The stability framework serves to aid in the theoretical analysis of algorithm for time-varying data. We apply it to different problems in the field of computational geometry, to achieve new theoretical results and insights into the stability of these geometric problems. Besides these theoretical results, we are also interested in improving the stability of techniques for real-world applications that benefit from stable algorithms. In our research we developed new algorithms for the automatic generation of overview visualizations for movement data (see figure).
One way of visualizing the movement of animals, in this case fish, is by giving an overview. An expert can use such an overview to identify salient time steps for further consideration. The overview sorts the fish at every point in time and places the orderings vertically along a timeline. Every fish is represented by a pixel, which we color according to a feature of that fish, such as swimming angle or speed. For the resulting ordering to be useful, it is important that fish that are swimming close to each other, are also close in the ordering, since they will exhibit similar features.
However, it is very important that consecutive orderings are similar, otherwise it is hard to track the changes of the fish over time. We developed algorithms that are equal or improve on existing techniques in terms of representing the fish well, but greatly improve on stability of existing techniques.
More information: research.tue.nl/en/publication … geometric-algorithms


