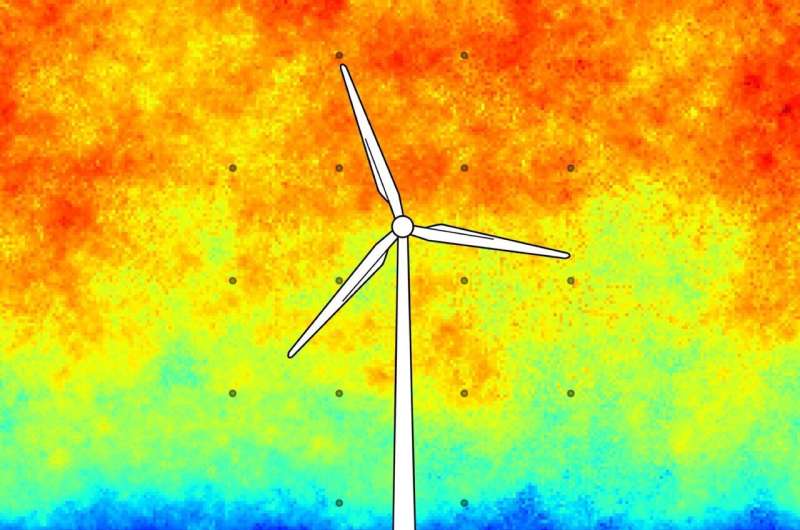
Using the data from 16 anemometers (indicated as grey dots) that were in operation at two measuring stations near the German North Sea coast in the 1980s, the team reconstructed a complete, three-dimensional wind field with the help of the new model. Here, a section can be seen. Blue and green hues represent low wind speeds, yellow and red hues represent higher wind speeds. Credit: University of Oldenburg/Jan Friedrich
Researchers at the University of Oldenburg, Germany, have developed a new statistical model with which they can describe wind turbulence with considerably greater accuracy than ever before. The team of scientists from the Institute of Physics and the ForWind Center for Wind Energy Research also developed a method that uses this model to calculate fully three-dimensional wind fields based on data from a limited number of real-world measurement points.
As the team led by Dr. Jan Friedrich reports in the science journal PRX Energy, the method is suitable for applications not just in the field of wind energy but also other areas, for example, in the calculation of aerosol concentrations or pollutant distributions in atmospheric turbulent flows.
Wind turbine manufacturers need to be able to describe wind conditions on the rotor blade as precisely as possible in order to estimate the load on components. Operators of wind farms also need to know already during the planning stage what the expected wind conditions in a determined location are in order to predict variables such as electrical output or noise generation.
To perform such analyses, the wind industry works with mathematical models that use statistical descriptions of wind speed fluctuations. However, these "wind field models" have a major shortcoming, as Friedrich explains: "The gusts are missing in these models. The wind blows far more steadily in the models than it does in the real world."
When winning the lottery is not all that rare
A team led by the Oldenburg physicist Prof. Dr. Joachim Peinke had already proven in 2012 that extreme fluctuations in wind speed occur far more frequently in the natural environment than in the models that are typically used. "An event that, according to the commonly applied Gaussian statistics, should occur only once every 1,250 years occurs once an hour in the real world," explains Peinke, who was also involved in the current study.
In other words, events that should be as improbable as winning the lottery—such as wind gusts uprooting a tree—are in fact not all that rare. Up to now there has only been a stop-gap solution for this problem: in applications, gusts are artificially added to wind models. But this approach reproduces real-world conditions inadequately and also takes up a lot of computing time.
With their new model, Friedrich and his Oldenburg colleagues were able to synthesize three-dimensional, realistic wind fields including turbulence with relatively little computational effort. The key achievement of their work was to randomly superimpose several slightly varying classical Gaussian statistics on each of the spatial points. The team can adjust the statistical properties of the resulting wind field—referred to as a "superstatistical random field"—as required so that the intensity and frequency of turbulence at the respective location correspond to real-world conditions.
A complete picture from just a few measuring points
In its study, the team also describes how their model can be used to accurately generate a fully three-dimensional, realistic wind field using data from just a few measuring points. "We can fill in, so to speak, the spaces between points arranged in a meteorological measurement mast array," Friedrich explains. This new approach is also interesting for practical applications in the wind energy sector, while at the same time allowing important research questions to be addressed using new methods.
This method of reconstructing wind fields of physical measurement parameters on the basis of a limited amount of data has a broad range of applications, according to the team. It could, for example, be used for detailed modeling of concentrations of pollutants or temperature distribution in urban settings using just a few real-world measurement data points.
More information: J. Friedrich et al, Superstatistical Wind Fields from Pointwise Atmospheric Turbulence Measurements, PRX Energy (2022). DOI: 10.1103/PRXEnergy.1.023006
Provided by University of Oldenburg


