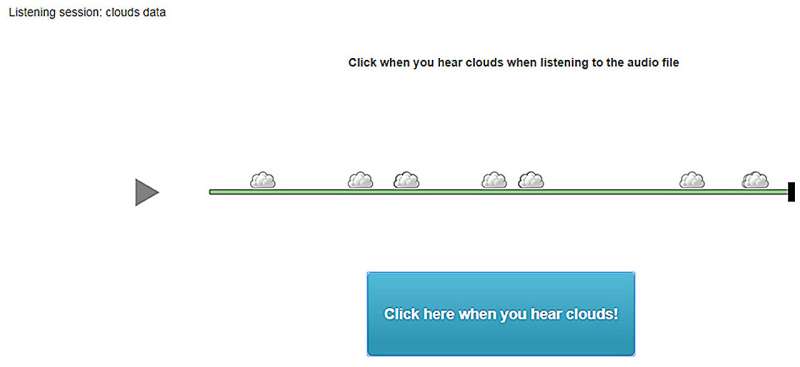
Survey engagement activity. Participants were asked to listen to a sonification, mapped from oktas data, and click when they heard clouds. Upon each click, a cloud would appear at the time point relative to the audio file. The activities of listening and responding to sonifications served as references for measuring engagement, which was the primary focus of the survey. The accuracy of the participants' responses was not measured. Credit: Frontiers in Big Data (2023). DOI: 10.3389/fdata.2023.1206081
Jonathan Middleton, DMA, a professor of music theory and composition at Eastern Washington University, is the lead author of a newly-published study demonstrating how the transformation of digital data into sounds could be a game-changer in the growing world of data interpretation.
The analysis was conducted over three years with researchers from the Human-Computer Interaction Group at Finland's Tampere University.
Recently published in the journal Frontiers in Big Data, Dr. Middleton's research paper examines how he and his co-investigators were primarily concerned with showing how a custom-built "data-to-music" algorithm could enhance engagement with complex data points (in this instance those collected from Finnish weather records).
"In a digital world where data gathering and interpretation have become embedded in our daily lives, researchers propose new perspectives for the experience of interpretation," says Middleton, who adds that this study validated what he calls a 'fourth' dimension in data interpretation through musical characteristics.
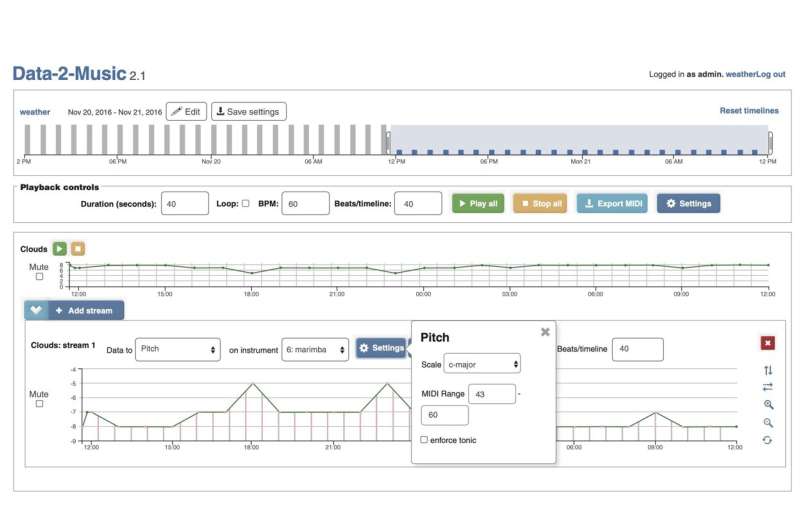
Sonification of clouds data collected from Finnish weather records. Credit: Jonathan Middleton
"Musical sounds can be a highly engaging art form in terms of pure listening entertainment and, as such, a powerful complement to theater, film, video games, sports and ballet. Since musical sounds can be highly engaging, this research offers new opportunities to understand and interpret data as well as through our aural senses."
For instance, imagine a simple one-dimensional view of your heart rate data on graph. Then imagine a three-dimensional view of your heart rate data reflected in numbers, colors and lines. Now, imagine a fourth dimension in which you can actually listen to that data. Middleton's research asks, which of those displays or dimensions help you understand the data?
For many people, in particular businesses that rely on data to meet consumer needs, this rigorous validation study shows which musical characteristics contribute the most to engagement with data. As Middleton sees it, the published article sets the foundation for using that fourth dimension in data analysis.
More information: Jonathan Middleton et al, Data-to-music sonification and user engagement, Frontiers in Big Data (2023). DOI: 10.3389/fdata.2023.1206081
Provided by Eastern Washington University


