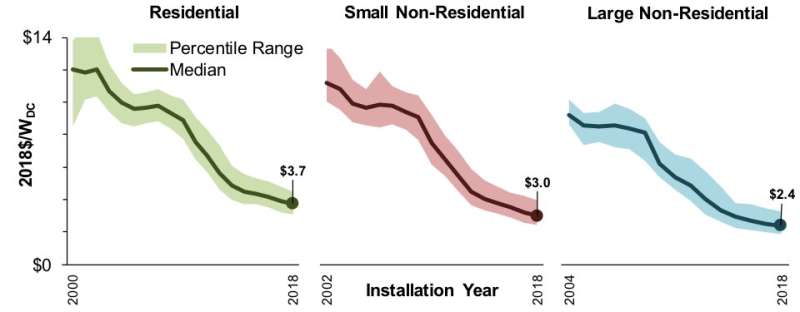
Distributed solar prices fall annually by 5% to 7%

The latest edition of Lawrence Berkeley National Laboratory's (Berkeley Lab's) annual Tracking the Sun report finds that prices for distributed solar power systems continued to fall in 2018, that industry practices continued to evolve, and that systems are getting bigger and more efficient.
The report describes price and technology trends for distributed solar projects nationally, collecting project-level data from approximately 1.6 million systems, representing roughly 80% of all systems installed through the end of 2018. More than 2 million distributed solar projects are currently operating in the United States.
Key findings from this year's report include:
- Installed prices continued to fall through 2018 and into 2019. National median installed prices fell year-over-year by 5% to 7% across the market, continuing trends seen over the past five years. Before any incentives, national median installed prices in 2018 reached $3.70 per watt for residential, $3.00 for small nonresidential, and $2.40 for large nonresidential systems.
- Installed prices vary by state. Prices per watt varied widely for all sectors and regions, ranging from a low of $2.80 in Wisconsin to a high of $4.40 in Rhode Island for residential systems. The range of prices for small nonresidential systems was similar, from $2.50 in Washington to $3.70 in Minnesota. State differences stem, in part, from underlying market conditions, such as market size and competition, as well as differences in permitting and interconnection processes, taxes, and incentives.
- Other drivers of prices. Other differences in price can stem from system size, module- and inverter-type, mounting-type, location, installer, host customer-type, and new construction vs. retrofits. This year's report for the first time includes a new appendix with an analysis that aims to isolate the effects of individual pricing drivers, including characteristics of the local photovoltaics market related to market size, competition, installer experience, and other factors.
- Market trends. Third-party ownership of residential and small nonresidential systems has declined in recent years, dropping to 38% and 14% of the 2018 sample, respectively. That trend reflects the emergence of residential loan products, among other factors. Third-party ownership of large nonresidential systems has, instead, shown no clear decline, representing 34% of the 2018 sample. Tax-exempt customers, such as schools, government, and nonprofit organizations—which are more often third-party owned, made up a disproportionately large share (roughly 20%) of nonresidential systems.
- Distributed photovoltaic systems keep getting bigger, more efficient. Median system sizes in 2018 grew to 6.4 kilowatts for residential and roughly 50 kilowatts for nonresidential systems, with 20% of the latter larger than 200 kilowatts. The larger system sizes partly reflect a steady growth in module efficiencies, which rose a full percentage point to a median of 18.4% among systems installed last year. The report also covers system design trends, including panel orientation, inverter loading ratios, solar-plus-storage, use of module-level power electronics, and third-party ownership.


