November 7, 2022 report
A computer model made from real images of soccer matches that shows the strategies used by each team

A trio of researchers with Ciudad Universitaria and Universidad Nacional de Cuyo has developed a computer model based on video from real soccer matches that can be used to help a team devise the best defense to use against an opponent. In their paper published in the journal Physical Review E, Andres Chacoma, Orlando Vito Billoni and Marcelo Kuperman, describe how they studied the dynamics of marking in soccer matches and used what they learned to create their model.
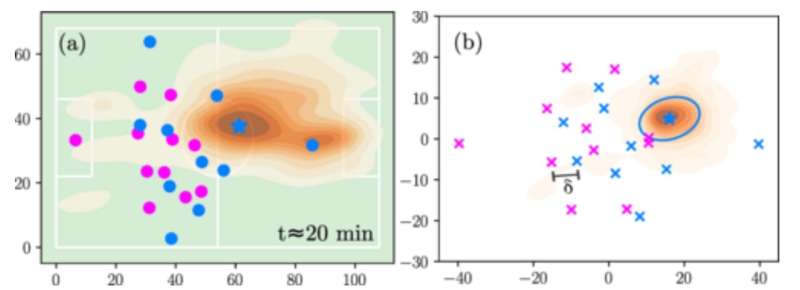
To learn more about the dynamics involved in defensive play during a soccer match, the researchers studied video of three real-world games. They then tracked the movements of all of the players throughout the match on a second-by-second basis. They also noted the distance between all of the players as the action ensued and the way defenders moved when a player on the other team approached. They also noted the types of actions taken by defenders to thwart opponent play.
The researchers then plotted all of their data on bipartite graphs—which were used to show the connections that existed between players as the game was played. One part of such graphs showed the number of opposing players that each defender had to face—a number that was described as branching factor K. In studying K, they found that it oscillated between values bigger and smaller than two. They also found that the duration, frequency, and size of clusters obeyed a scaling law.
The trio then created a simple computer model using what they had learned that allowed for animating the action in such a way that it showed nothing but dots moving on a computer screen. It consisted of showing 22 players (red or blue dots) in action with a spatial resolution of 10 centimeters moving at 25 fps. They also used smoothing routines to reduce noise. Interactions were shown as lines connecting players between opposing teams. They noted that the action of the players was based on spring-like connections between players.
The researchers suggest that studying the animation allows for noting patterns made by offensive players, which coaches could use when developing defensive strategies for their team.
More information: A. Chacoma et al, Complexity emerges in measures of the marking dynamics in football games, Physical Review E (2022). DOI: 10.1103/PhysRevE.106.044308 . On Arxiv: arxiv.org/abs/2207.09992
© 2022 Science X Network


