This article has been reviewed according to Science X's editorial process and policies. Editors have highlighted the following attributes while ensuring the content's credibility:
fact-checked
preprint
trusted source
proofread
Visualization technique to drive scientific discoveries, customer analytics, and more

Researchers from Skoltech and AIRI, Artificial Intelligence Research Institute devised a visualization technique that makes highly complex biomedical, financial, and other datasets accessible to humans without sacrificing their multidimensional structure. Retaining this so-called data topology is crucial for drawing conclusions about cancer genes, consumer behavior, and whatnot. Yet the existing methods are not good at it. The study will be presented as a conference paper at ICLR 2023, and the paper is available on the arXiv preprint server.
Corporate analysts and scientists often have to make sense of datasets where every item is characterized along many so-called dimensions. For example, a bank might rate each of its clients for a wide range of behavior indicators. Biologists consider various cells in terms of how active each of a large number of genes are in them. Weather data, too, are of that nature, because of the number of parameters reported for every point in time at every location.
Yet people are not used to thinking in many dimensions, and without reducing the dataset to a neat two- or three-dimensional representation, it might be difficult to come up with meaningful hypotheses and recognize important patterns.
"Visualization renders the data intuitive, but it does not necessarily reveal its 'shape.' A dataset might have a large-scale structure to it—complete with clusters, voids, loops, and so on—and we want all that to be in the reduced-dimensionality representation, too. Physicists need it to recognize distinct particles in a myriad detector blips, market researchers need it to identify consumer groups, climate scientists need it to tell where a certain process begins and where it ends. Unlike other techniques, ours achieves dimensionality reduction without compromising global data structure," said co-author Daniil Cherniavskii.
There are a number of approaches to reducing data dimensionality, some using so-called autoencoders. These are neural networks that create lower-dimensionality representations of the data. "The problem is that most of the techniques used, including those involving autoencoders, operate locally. They care about the position of a data point relative to the neighboring points, but the large-scale structure is lost," Cherniavskii said.
"What we did is we supplemented the autoencoder with a new additional loss function. Its sole purpose is to minimize topological discrepancy between the initial dataset and its low-dimensional representation. At loss equal to zero, the 'shape' of the visualization is guaranteed to match that of the original."
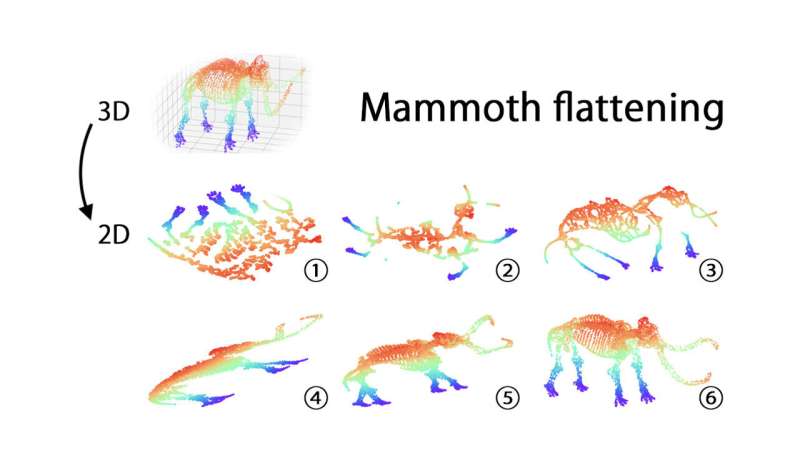
The team tested to what extent dataset topology is preserved using multiple metrics that capture how well the relative positions of the data points in general—not just those in the immediate neighborhood—are retained. The test, which encompassed datasets of varying nature, confirmed that the team's solution outperformed all the most popular methods for dimensionality reduction (see image above).
"Topological data analysis is becoming an increasingly popular tool for investigating the properties of multidimensional data. We expect that the method we have developed and other similar approaches will become the standard in the nearest future," study co-author Professor Evgeny Burnaev of Skoltech Applied AI and AIRI said.
More information: Ilya Trofimov et al, Learning Topology–Preserving Data Representations, arXiv (2023). DOI: 10.48550/arxiv.2302.00136


